

Determining the terminal value of your startup is a bit like assessing your favourite football club at the start of the season: you’re trying to project where they’ll end up, many victories and defeats later. In venture capital, terminal value represents the estimated worth of a startup at the end of a specific projection period: essentially, what is this business worth beyond the horizon of predictable cash flows? VCs use it to estimate the likely exit price, which in turn determines whether the investment is worth making.
They typically approach this through three lenses: projecting EBITDA in the final year and applying an industry-standard exit multiple; running a Discounted Cash Flow (DCF) analysis to capture the present value of all future cash flows beyond the initial 5–10 year projection period; or calculating the total expected valuation at a future exit event, whether that’s an IPO or an acquisition.
As a product manager, I find myself asking a very similar question: is the continued investment in this product or team actually worth it? Would I keep funding this if it was my own money? What return on investment or ‘product multiple’ do we need to see to justify the ongoing commitment?
These are uncomfortable questions. In my experience, PMs are often reluctant to pull the plug on a product, whether out of attachment, sunk cost thinking, or simply not having a clear framework for making the call. I’ve been there myself. I once made the decision to kill a product less than a year after launch because we simply couldn’t find a way to scale it. More recently, I’ve had to sunset a more mature feature where adoption had been flat for long enough that it was consuming resource we couldn’t justify.
Both decisions were hard. But having a structured way to think about terminal value – not just in financial terms, but in product terms – would have made them easier and earlier. Here are three frameworks I’d recommend PMs use.
Method 1: Product Payback Period

This is the most direct translation of VC thinking into product terms. The idea is to work backwards from the estimated future value of a product to determine whether the current investment will ever pay off and by when. If you want to go deeper on the underlying economics, my earlier post on understanding the unit economics of your product is a useful companion piece.
Start by estimating the product’s future annual revenue (or cost savings, if it’s an internal tool). I’ve made the mistake of doing this exercise without grounding my estimations in early signals such as historic growth rates, market adoption or Beta launches. This is like a chef estimating how many covers they’ll do on Saturday night without looking at the reservation book. Optimism is great, but it’s not a reliable forecast 🙂
Then calculate how long it will take to recoup the total investment to date, including engineering time, infrastructure costs, and ongoing maintenance. If the payback period stretches beyond what your business can reasonably sustain, that’s a signal you should reconsider making the investment.
Example: Imagine you’re running a B2B analytics add-on that costs £200,000 per year to build and maintain. Current annual recurring revenue from the add-on is £60,000. Based on current growth trends, you project the feature to achieve £120,000 ARR in two years. That gives you a payback horizon of roughly 3.5 years. Such a payback period might be acceptable in some businesses, but if your company typically expects payback within 18 months, you’ve got a problem worth confronting.
The payback period isn’t a pass/fail test on its own, but it forces the conversation. If the numbers don’t work even under (cautiously) optimistic assumptions, the product’s terminal value is effectively negative.
Method 2: Customer Value Scorecard
Financial projections tell you one part of the story. The other part is whether customers actually value the product enough to sustain and grow it. VCs look at customer retention, Net Revenue Retention (NRR), and engagement signals when assessing terminal value. As PMs we should assess user adoption early and often, to get more confidence in a product’s current and future impact.
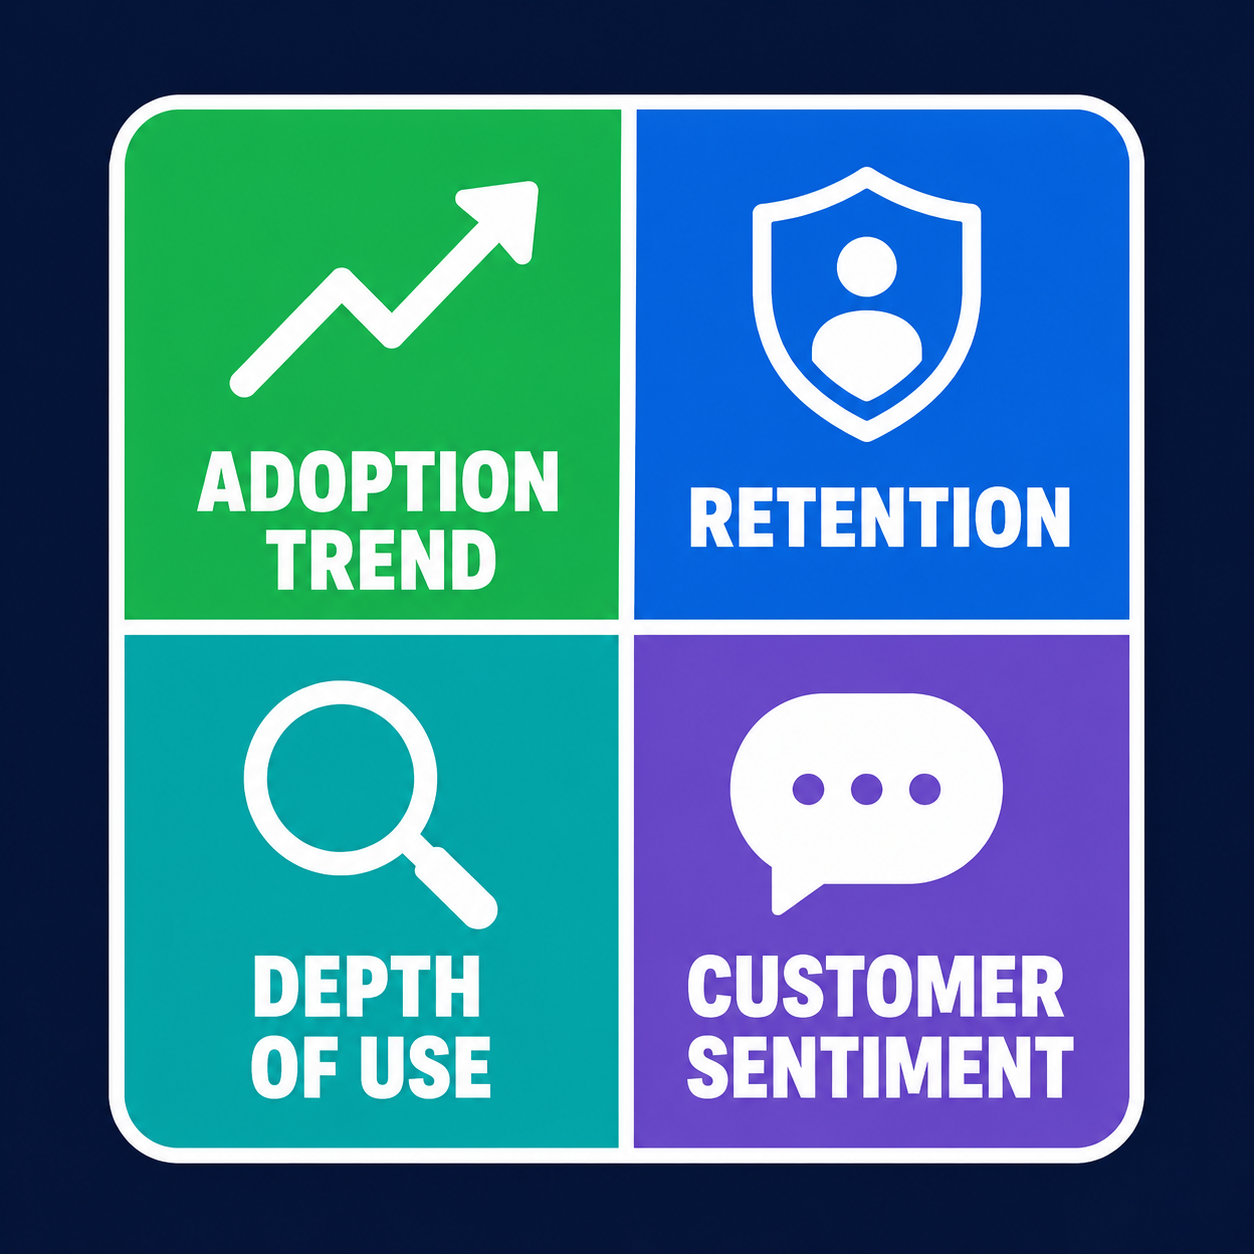
I’d suggest building a simple Customer Value Scorecard with four dimensions:
- Adoption trend: Is active usage growing, flat, or declining over the past six months?
- Retention:What percentage of users are still active 90 days after onboarding?
- Depth of use: Are users engaging with core features, or just dipping in occasionally?
- Customer sentiment: What are your NPS or CSAT trends telling you?
Score each dimension on a simple 1-3 scale and total them up. A product scoring 10-12 is healthy. A product consistently scoring 4-6 is telling you something important.
Example: I worked on a product where our activation numbers looked reasonable on the surface, with about 40% of new users completing onboarding. But when we broke it down, 90-day retention was under 20%, core feature engagement was low, and NPS was hovering around zero. Scored against the framework, the product was a 5 out of 12. We used this scorecard as a valuable data point for a conversation about sunsetting.
The advantage of this approach is that it separates signal from noise. A product can have good revenue numbers while quietly losing customers. Or it can have strong retention but poor monetisation. The scorecard forces you to look at both dimensions together.
Method 3: Strategic Option Value assessment
This one is a bit more qualitative, but it’s particularly useful for products that are early stage or operating in emerging markets. In finance, “option value” refers to the value of having the flexibility to make future decisions, even if those decisions aren’t fully defined yet. A product might not be generating great returns today, but it could be building capabilities, data, or market position that will be strategically valuable later.
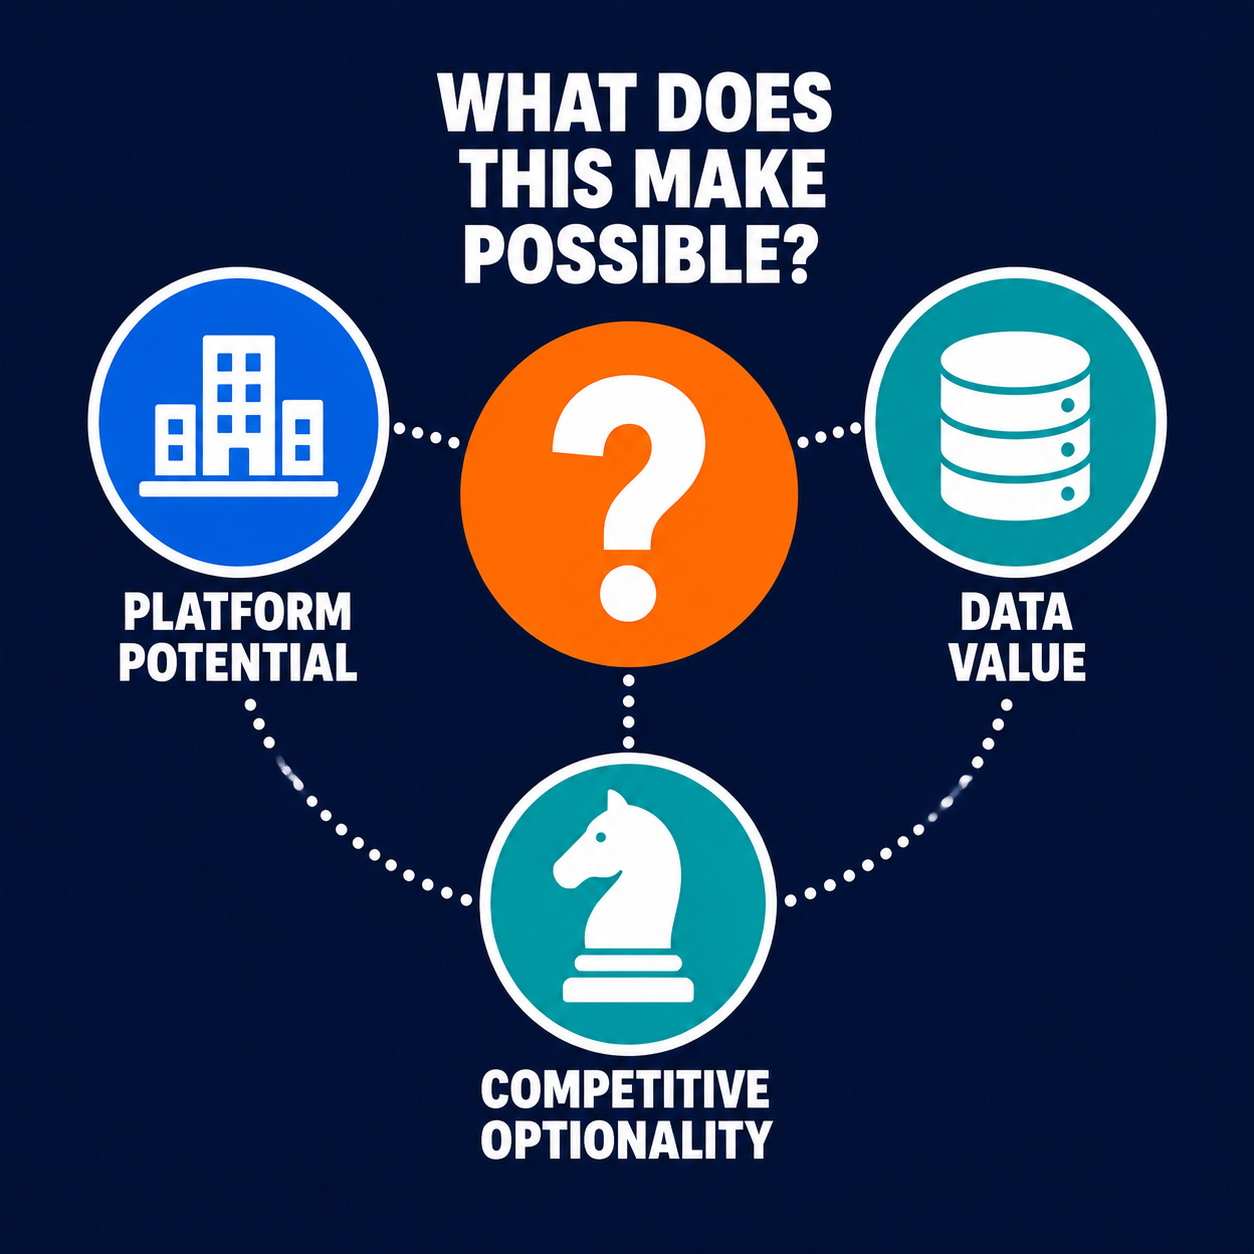
The key question is: what does continued investment in this product make possible that we couldn’t do otherwise?
To structure this, I’d assess three things:
- Platform potential: Could this product become the foundation for other products or revenue streams?
- Data and learning value: Is the product generating insights, user behaviour data, or model training data that has compounding value?
- Competitive optionality: Does maintaining this product prevent a competitor from occupying a strategically important space?
Example: Say you’re running a free consumer app with modest engagement and no current monetisation. On a pure payback basis, it looks terrible. But the app is generating rich behavioural data that your enterprise product team is starting to use to improve recommendations in the B2B version of the app. And it’s proving to a meaningful acquisition channel with 15% of your enterprise leads saying they first encountered your brand through the free tool. Suddenly, the terminal value of the app looks very different when you factor in the option value it provides.
This framework is deliberately a counterweight to the first two. It stops you killing products purely on short-term financial grounds when they’re playing a longer strategic role. It also helps you to compare opportunity cost of different product opportunities.
Bringing It Together: A Simple Decision Matrix
Used in combination, these three frameworks give you a much more complete picture than any single metric. I’d suggest mapping your product across all three to better understand the terminal value and before making a start/continue/stop/pivot decision:
- If payback period is acceptable and customer value is strong, keep investing.
- If payback is marginal but strategic option value is high, consider a pivot or a reduced-cost holding pattern.
- If all three frameworks are flashing red, you have your answer and you have the evidence to make the case clearly to stakeholders.
The goal isn’t to reduce a product decision to a spreadsheet. It’s to make sure that when you do decide to stop investing, you can articulate why. And when you decide to keep going, you can explain that too.
Main learning point: Borrowing terminal value thinking from venture capital gives product managers a more objective basis for one of the hardest decisions in the job: whether to keep investing in a product or team. Combining a payback period calculation, a customer value scorecard, and a strategic option value assessment gives you a framework that captures both the financial and the strategic picture.

