Whilst slightly struggling with identifying the most effective measurements for my own product I’m nevertheless learning lots of new things about when (not) to use data in developing products. I’ve been learning more about data-driven product design and some of the key things to consider when using data to inform your product decisions:
- Measuring events – What are the key events that we would like to track, and why? This is likely to vary per team or stakeholder. For instance, the number of events that Sales are most interested in is likely to be much smaller than the events that I, as a Product Manager, want to track (see Fig. 1 below). I guess the main thing is here that you pick the appropriate events to measure and set clear goals as to how you would like these events to perform. A good example is Wooga, a German games company, where the product team have a number of KPIs and metrics that they’re looking to deliver on. Each week they’ll pick a KPI e.g. retention and will look at all the activities they can design and measure to increase the chosen KPI. Alistair Croll and Benjamin Yoskovitz have introduced the notion of the “One Metric That Matters” in this respect, urging businesses to focus on a single metric that will really impact their business.
- Retention vs customer engagement – I like to distinguish between customer engagement and customer retention. Often they tend to get lumped together, but in my mind retention is all about if and how often people revisit your site or application. For instance, I find it helpful to do a cohort analysis to compare the number of users that signed up during specific time periods and their revisit rates. These figures should be a good reflection of site performance over time, and the idea being that revisit rates will go up as you continue to improve the site (blogger Andrew Chen has written a great blog post about this). With customer engagement, I tend to be much more interested in metrics such as click-through rates, conversions or discussions around content. Such metrics give a better insight into the extent which users engage with content or a service.
- Limitations of A/B and multivariate testing – I’m a big fan of testing multiple versions of a design, whether it’s just to compare two design versions (A/B) or to compare multiple variations of different design elements (multivariate testing). Again, the main challenge here is to ensure you’re testing the right things. You can potentially test a thousand different variables and combinations per web page or application, so I believe it’s critical to start off with the right business questions and to be disciplined about the things that you want to test (see Fig. 2 below).
- Data isn’t everything – Whether the data you generate is quantitative or qualitative (or both), I strongly believe that data doesn’t replace product vision or intuition. Data provides a very useful perspective when making a decision, but it shouldn’t be the only factor you’re considering. I know that a lot of my peers disagree with this view, but I’ve identified some constraints over time when it comes to relying on data (see Fig. 3 below). Essentially, I believe that data provide a very valuable lens to look at product performance but data can never be a substitute for ‘going out of the building’ (and talking to customers or competitors) or gut feeling. Data can help in validating intuition or initial assumptions but you’ll need to start somewhere!
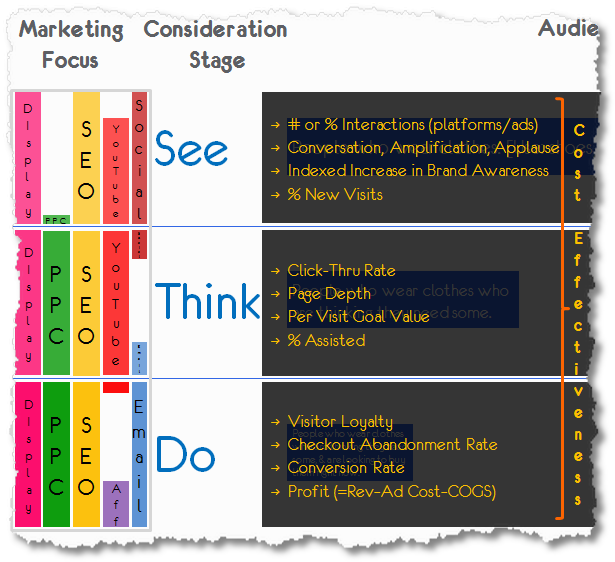
- Who are you measuring? – I’m learning more about user segmentation and how this can be reflected in the specific things you measure. I found the “See-Think-Do” framework by analytics guru Avinash Kaushik (see Fig. 4 below) very helpful in this respect. It helps to think about specific metrics to measure in relation to specific groups of users. I always find it very helpful to look at analytics within the context of user cohorts, just to get a better perspective.
Main learning point: data can provide a great framework for making business or product decisions. There are numerous professionals and companies out there who make decisions solely based on data. Data are objective and tangible. However, the pitfalls of solely relaying on user data shouldn’t be underestimated in my view.
Firstly, one can easily end up measuring the wrong thing or getting an incomplete picture. Secondly, one can become paralyzed by data, not trusting your product vision and becoming very driven by the users that you have (and not necessarily the users that you want).
If anything, I’ve realised again the importance of establishing a product vision, goals and assumptions first, before you even start contemplating which metrics to measure!
Fig. 1 – Examples of event types that I tend to track
-
Registration landing
-
Registration completion
-
Products entered in based
-
Proceed to checkout
-
Account creation
-
Page view
-
Click-through on search results
-
Documents created
-
Document shared
-
Post created
-
Post updated
-
Post shared
-
Comment created
-
Purchase
- Visits by a specif group of visitors
Fig. 2 – Things I’ve learned so far about A/B and multivariate testing
What is it that you want to test?
I’ve learned to be very specific about the business questions that I want answers on:
-
I want to improve the conversion rate of the basket checkout process by 5%
-
The aim is to get a 1,000 people to respond to the call to action in the email campaign
-
To see if the number of duration of time spent on a page drops if we introduce page ads
-
To create a shift from “spectators” to “participators”
-
To increase employee productivity from 2% to 5%
-
To convert the current 200 “inactive users” to “active users”, by having them complete at least one activity per month
What does success look like?
This is where I look at Key Performance Indicators and the related metrics to measure and test with:
-
“We know that the new landing page of our site or app is successful if we can reduce the bounce rate by 10%”
-
“We know that the new sign-up process is successful if we manage to increase the sign-up rate by 10% in the first week after launch of the new, simplified sign-up process”
-
“We know that the new “share an update” button is more effective if we see a 5% growth in month-on-month number of status updates shared.”
-
“We know that our user engagement is improving when the user who created a group are still creating groups in March”
Being disciplined about goals and picking the right variables
I’ve learned to try and stick one goal per page to test. Otherwise there’s a risk of things getting messy, making it hard to measure things and – most importantly – to get any meaningful outcomes for your testing in the first place.
Picking the right variables is another key thing. Which elements tend to cause the most friction (e.g. forms, sign-up, page length and process steps)? Which elements are key in achieving your goals? Also, make sure you don’t waste too much time on trivial elements such as text or headlines, because in the context of the key goals that you’re trying to achieve they’re likely to have less of an impact.
Fig. 3 – Some constraints when it comes to relying on data
- Data provides an insight into the ‘what’ but not necessarily into the ‘why’ or ‘how’ – Particularly quantitative data can be great when it comes to monitoring incremental change but is quite limited in providing real customer insight or show which new features create a breakthrough change. I therefore believe that data always needs to be augmented by other perspectives such as user feedback, competitor analysis, etc.
- You still need creativity, strategy and intuition (1) – I’ve seen the risk of people thinking that their analytics data were the holy grail, succumbing to ‘analysis paralysis’ or becoming risk adverse, being unable to make decisions without any available data. One could argue that this isn’t necessarily the fault of data but that of the decision making process around it. My point is that data is one – important- source of information to base a product decision on, but it shouldn’t be your sole perspective. For instance, there might be internal business or technical aspects that need to be considered.
- You still need creativity, strategy and intuition (2) – Also, customer monitoring can be very reactive, in a sense that you’re following your customers through their experience and optimise accordingly. However, you might want to drive to a specific strategy or have a new product (the relevant metrics to measure might only emerge over time). Ultimately, you will need to be creative or take a leap of faith to get the results that you want.
Fig. 4 – The “See-Think-Do: Measurement Strategy” framework by Avinash Kaushik
Related links for further learning:
- https://marcabraham.wordpress.com/2013/05/03/book-review-lean-analytics/
- http://altmetrics.org/manifesto/ http://www.wooga.com/2012/07/
- http://www.slideshare.net/wooga/metrics-driven-designdeveloper-conference-hh2012stephanie-kaiserjesper-richterreichhelm
- http://www.youtube.com/watch?v=MQcjAVY4xgk http://www.infoq.com/interviews/kaiser-metrics
- http://www.90percentofeverything.com/2011/01/06/local-maxima-and-the-perils-of-data-driven-design/
- http://www.wired.co.uk/magazine/archive/2012/01/features/test-test-test
- http://www.smashingmagazine.com/2010/08/26/in-defense-of-a-b-testing/
- http://37signals.com/svn/posts/2431-basecamp-home-page-redesign
- http://andrewchen.co/2008/09/08/how-to-measure-if-users-love-your-product-using-cohorts-and-revisit-rates/#
- http://www.forentrepreneurs.com/customer-engagement/
- http://www.kaushik.net/avinash/see-think-do-content-marketing-measurement-business-framework/
- http://www.kaushik.net/avinash/lean-analytics-cycle-metrics-hypothesis-experiment-act/
- http://insideintercom.io/the-problem-with-data-driven-decisions/
- http://andrewchen.co/2009/03/02/does-ab-testing-lead-to-crappy-products/
- http://www.webdesignerdepot.com/2013/05/the-perils-of-ab-testing/
- http://tech.onefinestay.com/post/43394522139/ab-testing-the-checkout-less-is-more

4 responses to “Some considerations regarding data-driven design”
[…] strong limitations to a purely data-driven approach (I’ve blogged about these constraints previously). In his talk, Ben stressed the importance of understanding and interpreting personal data and […]
[…] or has been launched fully, tracking usage data will only help you to learn so much (I wrote about the constraints of pure data-driven design last year). User interviews provide a great way to find out more about the ‘why’ behind […]
[…] sure which metric(s) to focus on – One of the things that I’ve learned the hard way is the importance of being clear upfront about the exact goal of the test and ensuring that […]
[…] Retention – The rate at which existing users are returning. For example: how many active users from a given time period are still present in some later time period? You may be more interested in failure to retain, commonly known as “churn.” […]